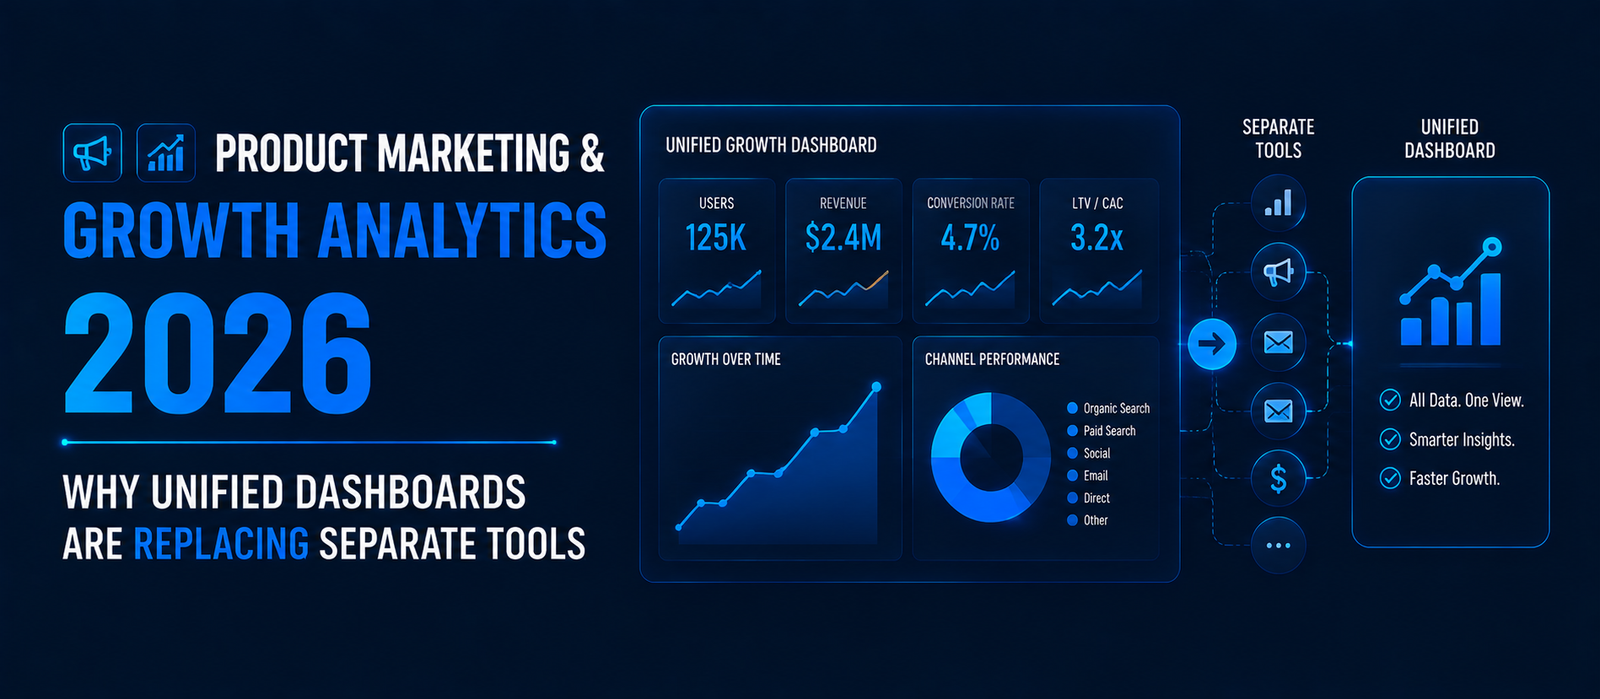
Marketing dashboards track acquisition; product dashboards track usage — and the two rarely agree. Growth analytics platforms are merging them into one system. According to MarTech's 2025 State of Your Stack survey, only 49% of tools in the average stack are actively used, and market data shows product analytics and customer data platforms both growing at 20%+ CAGR into 2026.
According to MarTech's 2025 State of Your Stack survey, only 49% of the tools inside the average marketing stack are actively used on any given day. Meanwhile, product teams are usually running an entirely separate toolset — Amplitude, Mixpanel, or Pendo — that marketing never opens. That disconnect is exactly what Product Marketing & Growth Analytics 2026 platforms are built to close: a single, shared view of the customer journey from first click to renewal, instead of two dashboards arguing over whose numbers are right.
This piece breaks down why the split happened, what the market data says about the shift toward unification, how to roll out a growth analytics platform without disrupting either team, and when it still makes sense to keep dashboards separate.
1. The Great Dashboard Divide: Why Marketing and Product Teams See Different Truths
Marketing dashboards and product dashboards were built by different teams, for different questions, using different data models — which is exactly why they rarely tell the same story about the same customer. A marketer looking at GA4 sees sessions, channels, and cost-per-acquisition. A product manager looking at Amplitude sees feature adoption, session depth, and churn risk. Neither view is wrong, but neither is complete on its own, and reconciling them usually means a spreadsheet, a Tuesday meeting, and a lot of disagreement.
Where Does the Dashboard Split Actually Come From?
The split has historical roots, not just tooling ones:
- Marketing analytics evolved out of ad tech and CRM — its native unit is the campaign, channel, or lead.
- Product analytics evolved out of engineering and UX research — its native unit is the user, event, or session.
- Each function bought its own tools, on its own budget, with its own vendor relationships, which hardened the silo over time.
What's the Real Cost of Disconnected Dashboards?
Consider a mid-size SaaS company where marketing reports a strong quarter of new signups while product reports rising churn in that same cohort — but nobody notices for six weeks because the two numbers live in different systems. By the time the teams reconcile the data manually, the budget for that quarter's campaign is already spent and the churn has compounded. That lag — not the tools themselves — is the real cost of the divide.
Pro Tip: Before buying any new analytics tool, map which metrics marketing and product each *already* track for the same customer stage (signup, activation, renewal). Overlap you find there is your fastest case for consolidation.
2. What Growth Analytics Actually Means (And How It's Different)
Growth analytics is not simply "marketing analytics with more charts" — it's a distinct category built around the full customer lifecycle: acquisition, activation, retention, and revenue, tracked as one continuous funnel rather than two separate ones. Where a marketing dashboard stops at "signed up" and a product dashboard starts at "logged in," a growth analytics platform treats that handoff as a single, unbroken metric.
Marketing Analytics vs Product Analytics vs Growth Analytics
| Dimension | Marketing Analytics | Product Analytics | Growth Analytics |
|---|---|---|---|
| Core unit | Campaign / channel | User event / session | Full customer lifecycle |
| Owner | Marketing team | Product team | Cross-functional growth team |
| Common tools | GA4, HubSpot, ad platforms | Amplitude, Mixpanel, Pendo | Unified platforms combining both data layers |
| Key question | "Where did they come from?" | "What are they doing?" | "What drives them from signup to revenue?" |
What's Different About the AI-Driven 2026 Version?
The 2026 wave of growth analytics platforms adds natural-language querying and AI-assisted anomaly detection on top of the unified data layer, letting a marketer ask a product-shaped question (or vice versa) without waiting on a data analyst. That's a meaningful shift from the dashboard-per-department model most teams grew up on.
Pro Tip: When evaluating a growth analytics platform, test whether a non-technical marketer can build a retention cohort query without engineering help — that's the real test of "unified," not just shared login credentials.
3. Product Marketing & Growth Analytics 2026: The Data Behind the Shift
The move toward unified growth analytics isn't a trend piece talking point — it shows up clearly in market and survey data from the past year. Tool sprawl, budget waste, and a growing appetite for a shared source of truth are converging at the same time, and each data point below points in the same direction.
Market Growth Numbers to Know
- According to MarTech's 2025 State of Your Stack survey, the average B2B organization runs 12–20 marketing tools, yet only 49% of them are actively used, and just 15% of organizations qualify as high performers on strategic ROI.
- According to Research and Markets, the global product analytics market is projected to grow from roughly $14.78 billion in 2025 to $18.12 billion in 2026, a CAGR near 22.6% — though estimates vary by research firm and should be treated as directional, not exact.
- According to MarketsandMarkets, the customer data platform (CDP) market — infrastructure that often underpins unified growth analytics — is projected to grow from $9.72 billion in 2025 to $37.11 billion by 2030, a CAGR of roughly 30.7%.
- According to Demand Gen Report's 2026 survey, roughly 50% of companies now report having a single source of truth for sales and marketing data, and 61% of marketing departments aim to implement one within the next 12 months.
Why Budgets Are Moving Toward Consolidation
Interestingly, some survey data shows appetite for adding *more* tools next year, not fewer — MarTech's survey found 67% of marketers still plan to expand their stack. That's not a contradiction: the growth is increasingly concentrated in platforms that absorb functions previously split across two or three separate products, rather than in single-purpose point tools.
Pro Tip: Don't chase the "unified" label alone — ask any growth analytics vendor for their exact data-refresh latency between marketing and product events. A platform that's unified but stale is just one dashboard with two blind spots instead of two.
4. How to Roll Out Growth Analytics: A Step-by-Step Process
Switching from siloed dashboards to a unified growth analytics platform is a data-modeling project as much as a software purchase, and rushing the migration is the single most common cause of failed rollouts. Treat it as a phased process with a pilot, not a company-wide switch flipped overnight.
Step-by-Step Implementation
- Audit existing dashboards — list every marketing and product metric currently tracked, and flag where the two teams define the same term (e.g., "active user") differently.
- Map a shared customer lifecycle — agree on one funnel definition (acquisition → activation → retention → revenue) that both teams sign off on.
- Shortlist unified platforms — evaluate tools built to ingest both marketing and product event data natively, rather than bolting the two together with custom scripts.
- Standardize event and property naming — before migrating any data, agree on naming conventions so "signup" means the same thing everywhere.
- Pilot on one funnel — run the new dashboard alongside legacy tools for a single product line or campaign before a full cutover.
- Roll out and retire legacy tools — once the pilot's numbers are trusted by both teams, sunset the redundant dashboards to actually capture the cost savings.
Common Pitfalls During Migration
- Migrating data before agreeing on shared metric definitions, which just moves the disagreement into the new tool.
- Skipping the pilot phase and losing team trust when early numbers don't match the old dashboards.
- Treating the rollout as an IT project instead of a cross-functional one owned jointly by marketing and product leadership.
Pro Tip: Run your pilot for at least one full sales or product cycle — a two-week test window rarely surfaces the retention and revenue discrepancies that justify the switch.
5. Growth Analytics vs. Traditional Dashboards: When to Switch (and When Not To)
Unified growth analytics isn't the right call for every team, and pretending otherwise sets up an expensive, unnecessary migration. The decision usually comes down to team size, how tightly acquisition and retention are already linked in your business model, and how much manual reconciliation is currently happening.
Comparison: Should You Switch?
| Signal | Favors Separate Dashboards | Favors Growth Analytics |
|---|---|---|
| Team size | Under 10 people, single owner for both functions | 10+ people across marketing and product |
| Reconciliation time | Under 1 hour/week comparing numbers | Multiple hours/week or recurring disputes |
| Business model | Simple, single-channel, low product complexity | Subscription/SaaS with distinct activation and retention stages |
| Data maturity | Early-stage, still defining core metrics | Established metrics, ready to standardize |
When Do Separate Dashboards Still Make Sense?
- Very small teams where one person owns both marketing and product reporting, and reconciliation is a non-issue.
- Highly regulated industries where marketing and product data must legally remain in segregated systems.
- Early-stage companies still discovering which metrics even matter, where a lightweight, flexible tool beats a heavier unified platform.
Pro Tip: If reconciling marketing and product numbers takes your team less than an hour a week, the cost of migrating likely outweighs the benefit right now — revisit the decision as headcount grows.
Summary
The divide between marketing and product dashboards was never a technology limitation — it was an organizational one, hardened by separate budgets, separate vendors, and separate definitions of "growth." The data shows that divide closing fast: tool sprawl is prompting consolidation, product analytics and CDP markets are both growing at double-digit rates, and a growing share of companies report reaching a genuine single source of truth. For any team weighing the switch, Product Marketing & Growth Analytics 2026 is less a buzzword than a description of where the market is already heading.
Key Takeaways
- Only 49% of tools in the average marketing stack are actively used, per MarTech's 2025 State of Your Stack survey — a strong signal that consolidation, not more tools, is the real opportunity.
- The global product analytics market is projected to grow from roughly $14.78B (2025) to $18.12B (2026) at a ~22.6% CAGR, according to Research and Markets — though figures vary by research firm.
- The customer data platform market is projected to grow from $9.72B (2025) to $37.11B by 2030 at a ~30.7% CAGR, according to MarketsandMarkets.
- Roughly 50% of companies now report a single source of truth for sales and marketing data, per Demand Gen Report's 2026 survey, with 61% of marketing departments planning to implement one within 12 months.
- 67% of marketers still plan to expand their toolset next year, per MarTech, showing consolidation is happening within platforms even as raw tool counts grow.
- A phased, pilot-first rollout — not a full cutover — is the difference between a trusted unified dashboard and a stalled migration.
If your marketing and product teams are still reconciling numbers in a spreadsheet every week, it's worth auditing your stack against the framework above before your next budget cycle.
Quick Summary
Product Marketing & Growth Analytics in 2026 is converging separate marketing and product dashboards into one shared source of truth — a divide that was always organizational, not technical, driven by separate budgets, vendors, and definitions of "growth." Tool sprawl is pushing consolidation, both the product analytics and CDP markets are growing at double-digit rates, and a growing share of companies now report reaching genuine unified reporting. For teams weighing the switch, unified dashboards are less a buzzword than a description of where the market is already heading.